平均律の場合です。
二つのキーから 音程比の“うなり”を求めてみます。
キー番号 37と42(5度音程)の 4倍音と3倍音で計算します。
> getQbeat(37, 42, 4, 3)
ans =  0.99430
function beat = getQbeat(key1, key2,\
                        ratio1, ratio2)
  freq1 = getFrequ(key1)*ratio1;
  freq2 = getFrequ(key2)*ratio2;
  beat = freq2-freq1;
end
> getFrequ(37)
ans =  220
function freq = getFrequ(key)
  freq = 440*2.^((key-49)/12);
end
しかしそれでは 一々面倒なので 引数を キーの間隔(4度では 5、 オクターブでは 12など)に変更してみます。
まず Interval.mは キーの間隔から間隔・下と上の倍音数・音程名を求めます。
> [inte name] = Interval(5)
inte =

   5   4   3

name = P.4th
function [inter, intst] = Interval(inte)
  intn = [0 1 1; 1 16 15; 2 9 8; 3 6 5; 4 5 4; 5 4 3; 6 7 5;\
          7 3 2; 8 8 5; 9 5 3; 10 7 4; 11 15 8; 12 2 1;\
          16 5 2; 19 3 1; 24 4 1; 28 5 1; 31 6 1; 36 8 1];
  ratio = {'Unison' 'mi.2nd' 'Mj.2nd' 'mi.3rd' 'Mj.3rd' 'P.4th' 'Dim.5th'\
           'P.5th' 'mi.6th' 'Mj.6th' 'mi.7th' 'Mj.7th' 'Octave'\
           '10th' '12th' '2octave' 'Oct.10th' 'Oct.12th' '3octave'};

  inter = -1;
  intst = '';

  x = find(intn(:, 1) == inte);
  if (x > 0)
    inter = intn(x, 1:3);
    intst = ratio{x};
  end
end
では キー番号とキー間隔から“うなり”を求めます。
キー番号 37の 音程 5(4度)です。
> getQbeat1(37, 5)
ans =  0.99430
function beat = getQbeat1(key,inte)
  ratio = Interval(inte);
  freq1 = getFrequ(key)*ratio(2);
  freq2 = getFrequ(key+inte)*ratio(3);
  beat = freq2-freq1;
end
その getQbeat1.mを使って キー全体の“うなり”を求めてみます。
function dispQbeats(intes)
  for inte = intes
    ks = 1:88-inte;
    beat = getQbeat1(ks,inte);
    plot(beat,'@')
    hold on
  end
  hold off
  xlabel('Key')
  ylabel('Beat')
end
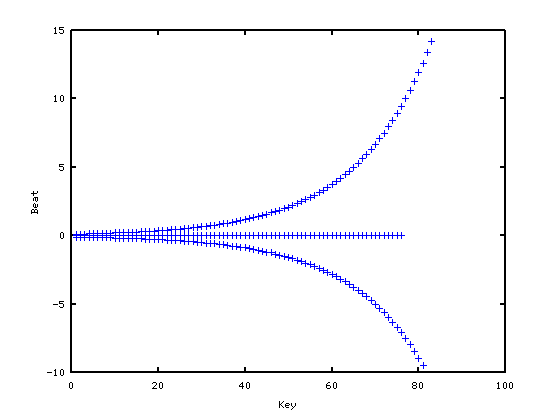
5(4度)・7(5度)・12(オクターブ)の“うなり”を一緒に表示します。
> dispQbeats([5 7 12])
画面の表情を整える為に もう少し付け加えると
function dispQbeats1(intes)
  n = 1;
  for inte = intes
    [intr ra] = Interval(inte);
    ks = 1:88-inte;
    beat = getQbeat1(ks,inte);
    str = strcat(';', ra, ';@', getCP(n++));
    plot(beat, str)
    hold on
  end
  hold off
  xlabel('Key')
  ylabel('Beat')
  grid on
  legend(2)
  axis([1 90])
end
> getCP(1)
ans = b+
function cp = getCP(num)
  colors = {'y', 'b', 'r', 'm', 'g', 'c'};
  points = {'h', '+', 'x', '*', 'o', '^', 'v', '>', '<' ,'s', 'd', 'p'};

  c = mod(num, length(colors))+1;
  p = mod(num, length(points))+1;

  cl = colors{c};
  pt = points{p};

  cp = strcat(cl, pt);
end  # グラフで表示する点の形と色を決めます。
> dispQbeats1([5 7 12])
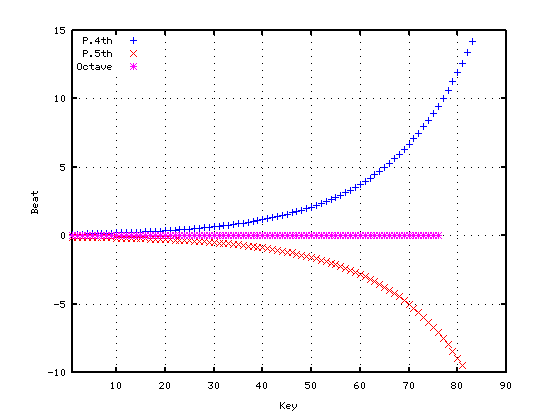
となります。